
Regional Banks: Value Destroyers |
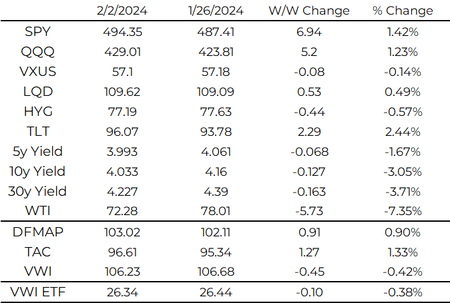
Recapping our current income portfolios:
DFMAP (Dividend Focused Multi-Asset Portfolio)
TAC (Treasuries Across the Curve)
VWI (Volatility Weighted Income) *Note VWI rebalances this Thursday
Please reach out if you would like to learn more about them.
We shared our thoughts on NYCB and regional banks this week with etf.com: "Owning regional banks requires an abnormally high desire for pain,” said Yang Tang, co-founder of ETF issuer Arch Indices. (Link to Article)
NYCB is a poorly run institution but the CRE impact is not isolated. This is a long read so to summarize: regional banks do not belong in your equity allocation and preferreds do not belong in your income allocation.
Regional banks have a challenged business model with CRE issues in the early innings of repricing in the new interest rate environment. Preferreds are 80% financials (50% bank issuers), lack of price appreciation, and only yield 7%. There are better ways to generate income in this interest rate environment.
Investors are frequently drawn into these assets when there’s a big dip and turn into long-term holders due to anchoring bias. We strongly caution against that: investors are better served with an optimized portfolio for their goal and sticking with the plan.
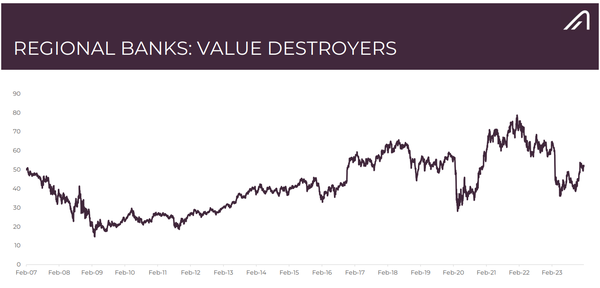
Regional Banks Equity is a Value Destroyer
Regional bank equity are value destroyers because of the leveraged model with the ability to go to 0 overnight. Since Feb 2007, KRE has been flat with several notable 60% plus drawdowns. To put this in perspective: the US economy grew over 36% and SPY appreciated from 145 to 494 (over 340%). The shareholder would’ve been better off owning a government bond ETF given similar returns with much less volatility.
The Regional Bank Business Model does not Reward Shareholders
There are close to 5,000 banks in the United States with the money center banks in a class of their own. The regional banks are smaller in size, concentrated in commercial and real estate lending, and relationship driven to originate loans and fund with cheap deposits. The business model has become increasingly challenged from shocks wiping out shareholders, macroeconomic pressures, and secular changes in consumer banking behavior.
Secular shifts in banking are here: the majority of mortgage origination occurs outside of the banking sector and direct lending is becoming more prolific. Perhaps nothing would worry a regional bank executive more than the ease of using your phone to move deposits to a high yield savings account.
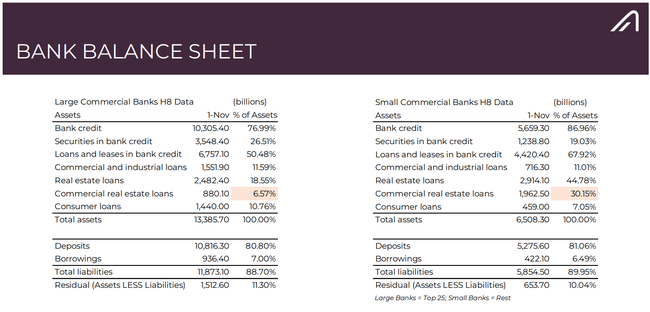
We detailed our thoughts on the securities portfolio and CRE issues facing regional banks in November (Link). CRE loans account for 30% of regional bank balance sheets while the securities portfolio is underwater. Since then, CRE has only gotten more attention and the first Fed rate cut is still months away.
CRE is a broad universe: multi-family housing, hotels, retail, and office. We are all aware of office occupancy and loan issues in major cities: it was even on 60 Minutes recently. The core issue is the 0% interest rate environment is over and property valuations have not reflected that.
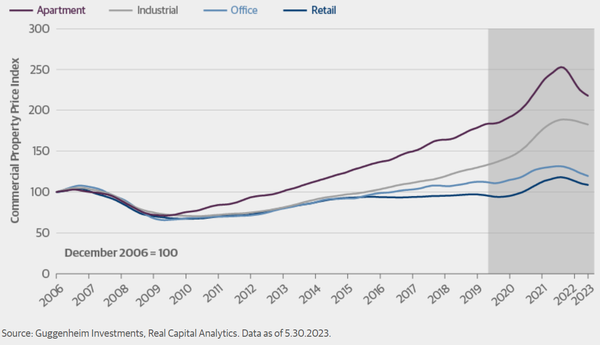
CRE Valuations have NOT Re-priced for the 5.5% World
CRE investors have high leverage and use cap rates as a guide for valuation (the free month of rent versus monthly rent discount mentality). When interest rates were 0, a 4-5% cap rate on a trophy property looked very attractive. Banks lent against that all day long. Today the risk-free rate is 5.5% and even in a 3.5% rate world, what is the right cap rate? The headlines of property values declining to multi-year lows is extremely troubling for lenders and suggests the "low" Loan-to-Value ratios may not be that low.
Property valuation declines are not isolated to one sector but broad based. CRE properties must generate more income to receive higher valuations. We highlight Freddie Mac’s multi-family apartment index here which tracks both property valuation and net operating income. Property valuation has greatly outpaced net operating income over the last 15 years. The doubling of mortgage rates over the last 2 years is a big headwind for income and valuations.
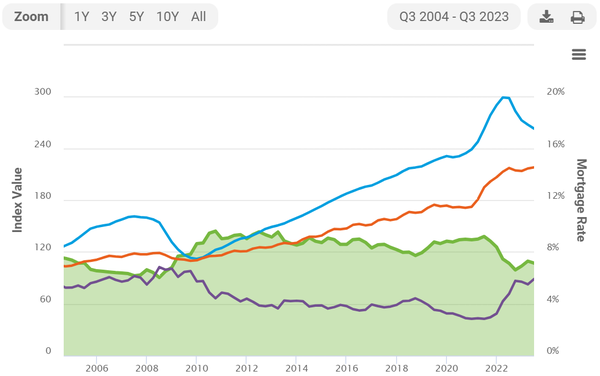
Freddie Mac Apartment Investment Market Index: Blue = National Price, Orange = Net Operating Income Index, Purple = Mortgage Rate
New York Community Bank: Canary in the Coal Mine?
NYCB was a textbook case of poor bank management. It started as a roll-up of NYC area savings banks and was concentrated in non-luxury multi-family loans (slum lords) funded by expensive money. NYCB consistently ranked among the highest loan/deposit ratio banks over the years.
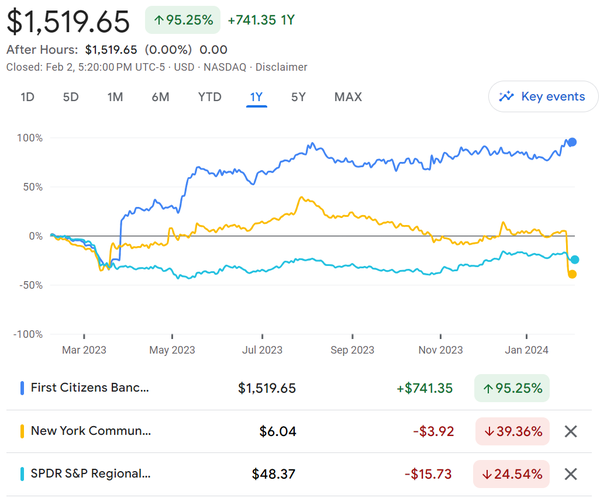
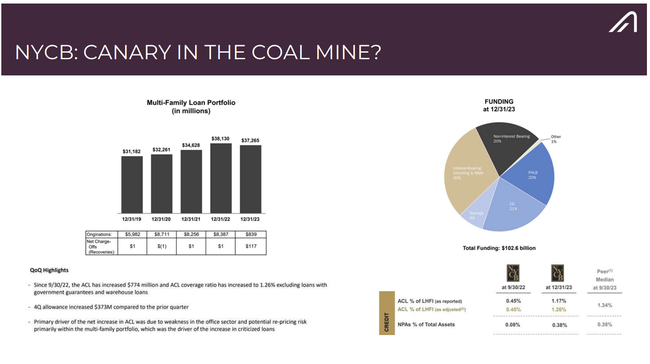
The FDIC gave NYCB a gift last year by giving it Signature’s deposit base and some loans (the FDIC kept the problematic loans and auctioned them off). Even with this gift, NYCB still has over half of its funding from the FHLB and CDs. Perhaps no better comparison can be made than to First Citizens: the acquirer of SVB assets. When the FDIC gives you a closed bank on the cheap, shareholders usually benefit. NYCB management has proved themselves to be an exception.
With a loan book yield of 5.72% and marginal funding cost of over 5.5%, it’s not hard to see why this is a problem institution.
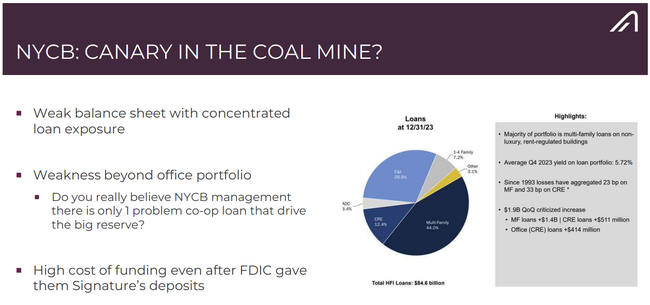
NYCB has always touted its risk management on its loans with low loan losses versus the industry. Management stated that there’s only 1 problematic loan after reviewing its multi-family portfolio in Q4.
Bad lenders make money in good times and good lenders lose money in bad times. Even if a bank has excellent risk management in a rising asset environment, is it applicable when asset prices decline? Is there enough real estate sponsor equity to go around to re-fi the loans at lower valuation and higher rates? A rising tide lifts all boats.
NYCB Outcomes:
Scenario 1: NYCB models are all correct, defaults do not increase, and they can build equity from dividend cuts. This is what equity holders pray for: no more issues and significant increase in stock price.
Scenario 2: NYCB is pressured to raise capital from regulators to shore up the balance sheet. The credit rating to junk is not helpful and current equity holders are severely diluted as the stock was “cheap” before the decline this week.
Scenario 3: NYCB is pressured into a merger with another bank by the regulators. Equity holders get very little but it is better than a regulator takeover.
Scenario 4: Headlines pressure funding on NYCB. FDIC discourages raising CD rates further and FHLB funding is exhausted. NYCB finds itself in dire straits and the OCC closes them down at 4p on a Friday afternoon.
We do not have an active view of any regional banks inside our Arch Indices products but it should come as no surprise they receive little weighting due to the realized volatility and mediocre metrics.
We do not think this will be a broader issue outside of regional banks and CRE: the regulators have a playbook to deal with these banks. The playbook involves forcing a capital raise, merger, or closing down the institution. These scenarios are not equity and preferred stock friendly. It will be a drag in the years to come but we are of the view that it will be contained.
The GFC was not caused by subprime lenders, it was caused by policy errors in dealing with troubled institutions and the credit collapse following the failure of Lehman Brothers.
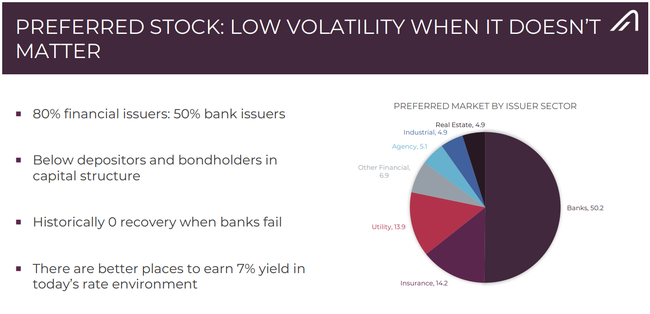
Preferred Stock: There are far better options for the income allocation
We wrote extensively about why preferreds do not belong in your income portfolio. The main issue is risk management: there are better ways to earn 7% yield here without the negative convexity.
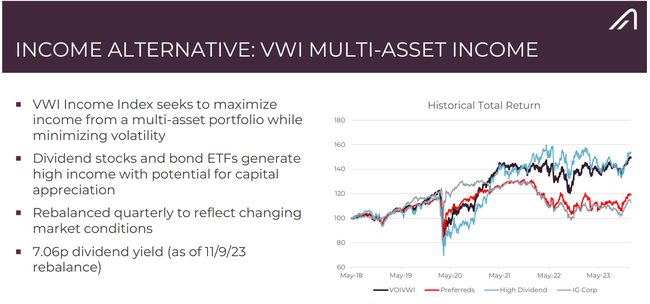
Given the concentration of 80% financial issuers (50% bank issuers), lack of capital appreciation, and rate environment, investors do not have to look far for better alternatives. We highlight our VOIVWI multi-asset income index as an alternative: high income, low volatility, and 81% dividend stocks with potential for capital appreciation.
| As always your thoughts and feedback are very much appreciated! |


