
Arch Indices Weekly Thoughts: November 13, 2023 |
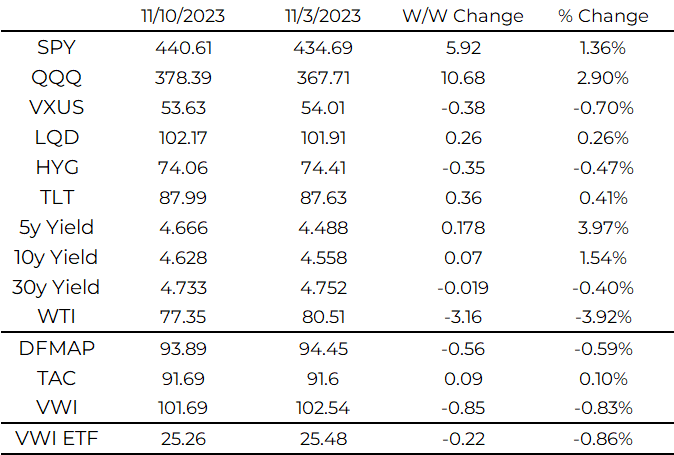
Recapping our current income portfolios:
DFMAP (Dividend Focused Multi-Asset Portfolio)
TAC (Treasuries Across the Curve)
VWI (Volatility Weighted Income)
Please reach out if you would like to learn more about them.
This is longer than our usual weekly but we want to highlight two important topics: 1) the downside of owning income instruments with much greater downside than upside: preferred stocks and 2) the tail risk of interest rate hikes causing a big major crisis in the banking sector and the real economy. We are not “doomers” by any measure but in a late cycle economy: it is more than prudent to understand risk in the risk/reward discussion.
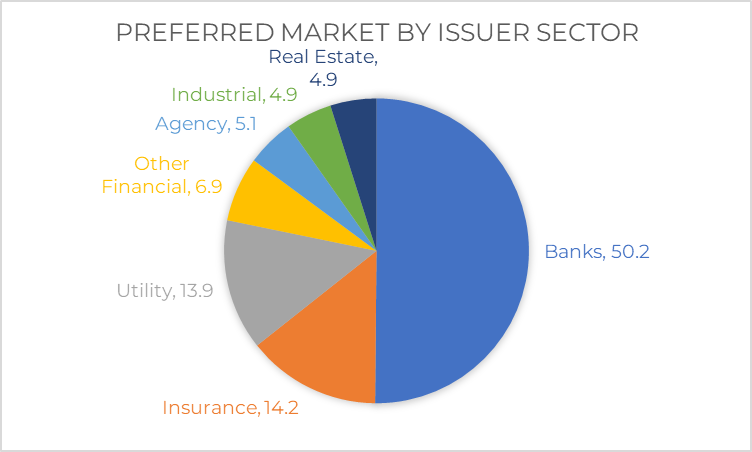
80% of preferred stock outstanding are issued by financials and 50% are banks. This is an opportune time to re-allocate to assets that have similar current income but less negative convexity and downside risk in an inevitable economic downturn. Preferreds are lower on the capital structure than bonds and historically have little recovery in a default. As Credit Suisse contingent capital bonds have demonstrated, “too big to fail” protects depositors and the financial system, not holders of hybrid instruments (who got 0).
Perhaps nothing would worry the Fed/Treasury more than a collapse in credit to the real economy caused by a banking crisis. The financial reform of the last decade and half was designed to create liquidity buffers inside banks, contingent capital in times of stress, and limiting leverage to reduce risk. However this was not applied equally to all banks: the regulators created three tiers of regulations: systemically important (GSIB), regional, and sub-10bn community banks.
The GSIB banks bore the brunt of the regulatory environment and have been forced to change many parts of the business model. Risk taking was discouraged and many of us who worked in the trading businesses have moved on to new ventures (Arch Indices being a great example). GSIBs were never big lenders to Main Street and focused on institutional clients, corporations, and wealth management. GSIBs are the most conservative balance sheets with low loan-to-deposit ratios, diversified funding sources, and robust asset-liability management programs.
The regional and the community banking sector is where the problems are. They have always been big lenders in commercial real estate and have used deposits accumulated during COVID to buy bonds before the Fed started the inflation fight. As seen with the regional bank collapses this year, many did not have a strong understanding of their deposit beta with fast growth over the last decade and less-than-robust ALM practices. While SVB was an exception in how large the securities portfolio was and the business model of the “market bank”, the entire regional bank industry faces similar problems.
This brings up our first point of concern: the accumulated losses in the securities portfolio. As highlighted by Ethan Heisler, the Bank Treasury Newsletter founder and long-time Bank Strategist at Salomon/Citi, unrealized fair value losses in the securities portfolio are over 30-35% as percentage of total equity at end of Q2. Of note, this was before the bond sell-off of the last 2 months.
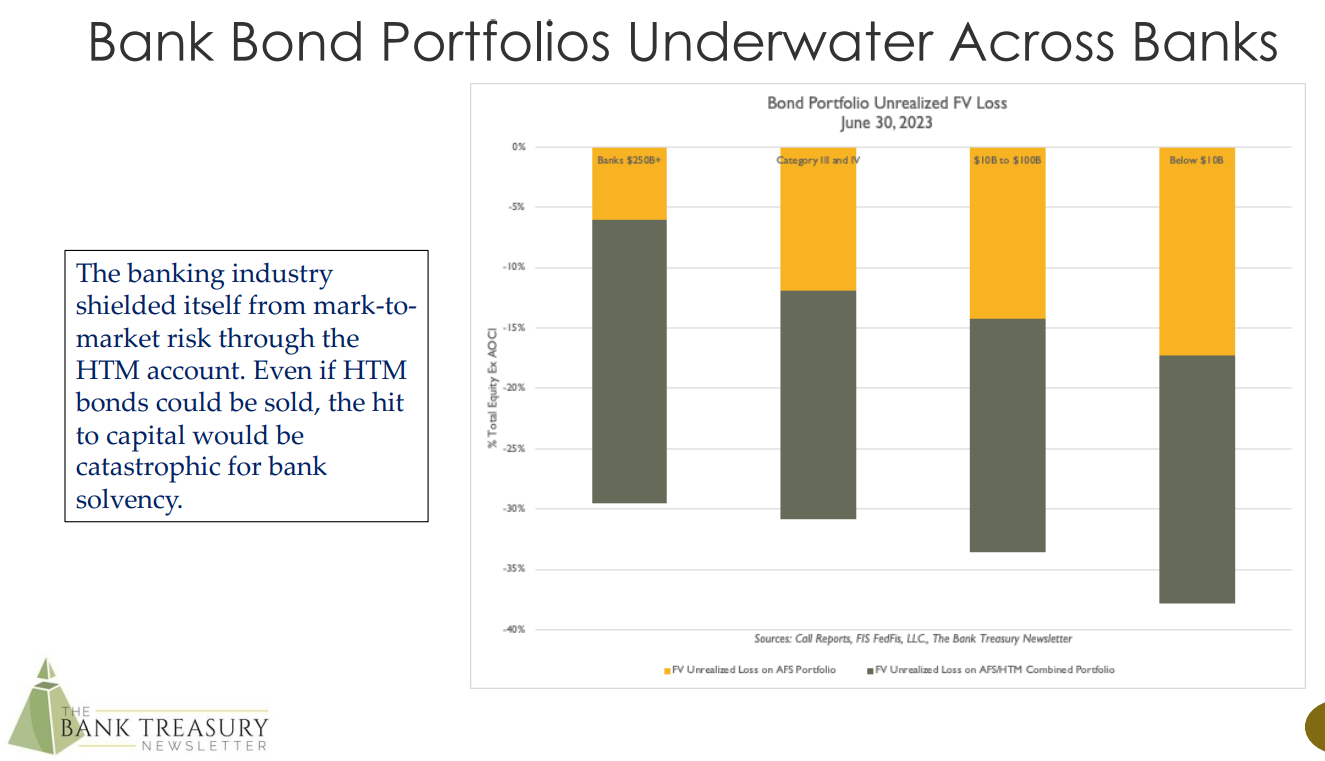
How did this happen? There's 3 ways for banks to classify securities holdings: trading (always mark-to-market), available-for-sale (MTM if you're above a size), and held-to-maturity (no MTM). Non-GSIB banks get a pass on the fair value of the securities in AFS for earnings and capital calculations through an accounting rule called the AOCI filter. The fair value of securities are excluded from capital calculations (bonds are marked at cost) by removing the impact of securities fair value from “all other comprehensive income.” Banks have also moved bonds into HTM to further isolate themselves from accounting implications (available for all banks).
While there is merit in reducing accounting and capital volatility for holding US Treasuries and Agency MBS (you have no credit risk in those instruments), it does create a HUGE issue if liquidity is needed.
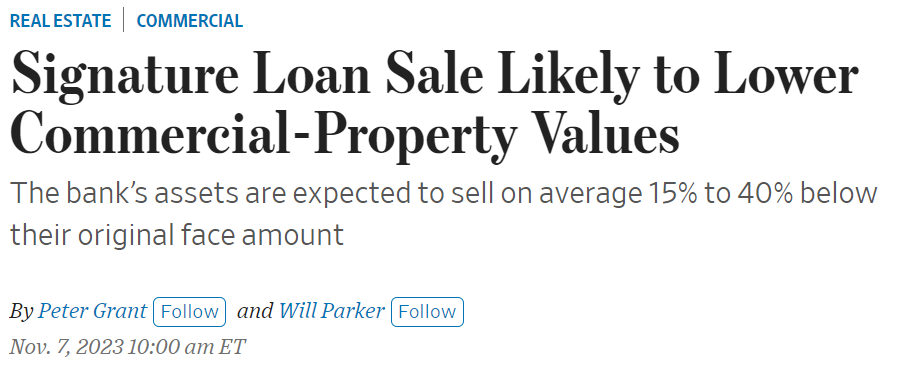
Regional and community banks also constitute the bulk of lending in commercial real estate. This is our second point of concern. The FDIC auctioned a loan portfolio from Signature Bank this week and it stuck out to us how underwater that loan book was. Signature was not an aggressive lender and a portfolio of multi-family, hotels, retail, and office loans in the NYC area went for a discount of 15 to 50% from face value. Regional banks often tout their CRE loans as conservative with loan-to-value of 50 to 60%.
This brings up an important question: if a loan that has an LTV of 55% is sold at a discount when the economy is still healthy (though late cycle), what are options for a bank in a liquidity run during a recession? How do you deal with commercial real estate in a higher-for-longer world when the borrower used 4.5% cap rate in the 0 rate world?
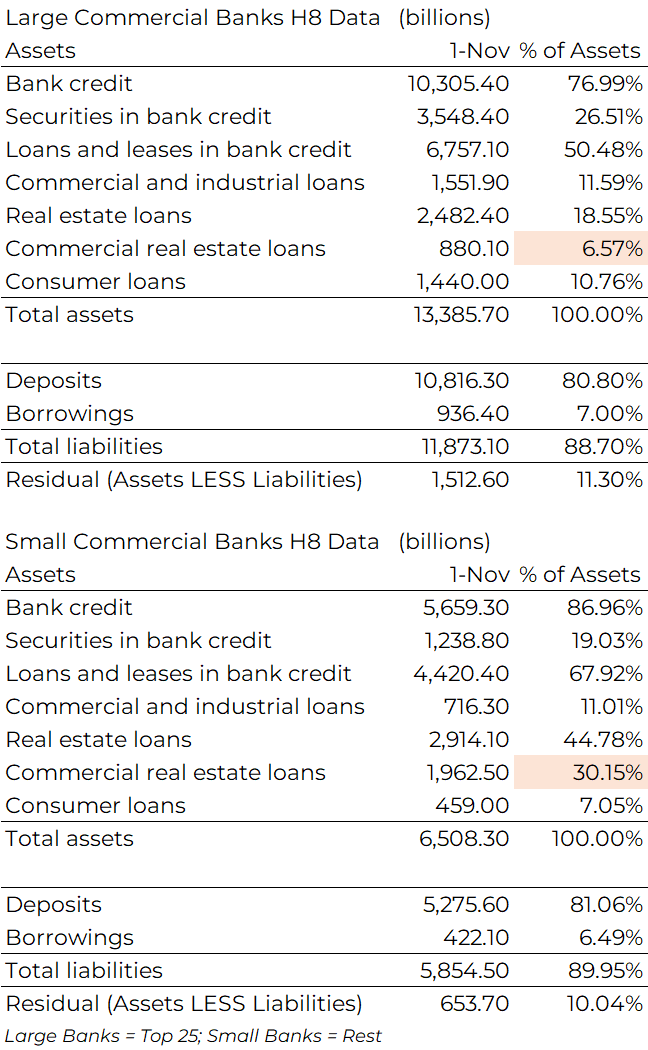
Just how big is this issue? Quick back of the envelope math: of the 23trn assets in the US banking sector and 3trn in CRE loans, 7trn of assets sits with the large 4 banks and approximately 400bn of that is CRE loans. The remaining 2.5trn in CRE loans constitutes 16% of the 16trn assets of the banks ex-big 4. Given that 35% of the equity is already gone in a mark-to-market of the securities portfolio, a 25% discount on the CRE loan book would wipe out almost 42% of the banking industry equity remaining after the securities MTM.
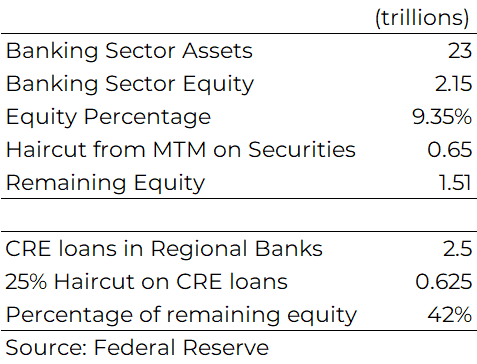
The analysis above is actually very generous to regional bank capital because we counted all capital in the banking sector, including big 4, but excluded big 4 CRE loans in haircut. From the Small Bank H8 data, CRE loans account for over 30% of all assets at banks not in the Top 25. (NB: The Fed H8 data separates Top 25 vs rest as Large vs Small but in reality there's a big difference in Big 4 Money Center banks vs the 21 large regional banks)
The main question is what causes a liquidity run on banks? After all, most banks go under from a run. We pinpoint the following factors: 1) consumer awareness of money market and high yield savings rates, 2) penetration of mobile banking and ability to shift money quickly, and 3) cash burn by consumers and corporations in a downturn.
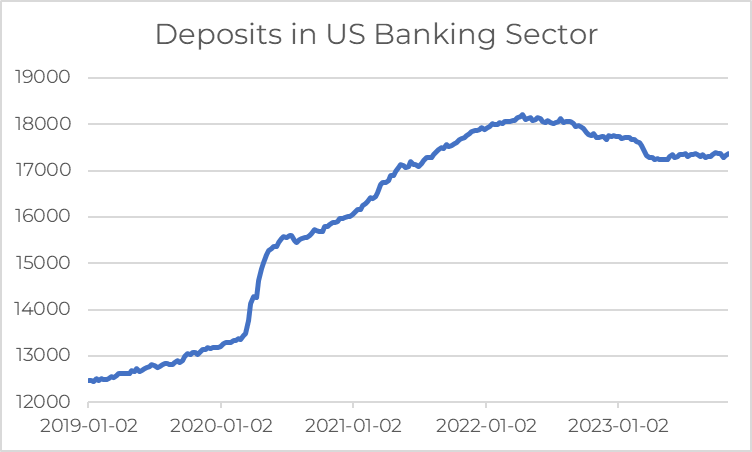
It’s pretty staggering the increase in deposits post-COVID and it’s even more alarming the amount of securities bought at low rates during that period with those “hot” deposits.
We are not the only ones who know this and suspect there is a working group inside our regulatory and policymakers that are crafting a plan to deal with this. Our recommendations would be: 1) a term repo facility for banks on UST and Agency MBS at face value, 2) invite private capital to work out loan books and encourage securitizations, and 3) encourage bank mergers to find economies of scale. Of course, a number of rate cuts and quantitative easing would be helpful .. if inflation is not of concern.
This brings us to the preferred market which is composed of 80% financials and 50% banks. The risk/reward looks particularly unfavorable given the potential for unlimited downside but no capital appreciation in combination with concentration of banks. Preferreds are below corporate bonds in seniority but above common stocks which gives the perception that they are a "safer" asset class.
The over 7% yield may look attractive but in the higher-for-longer environment we believe there are better products for an income portfolio in the market.
Below are the key preferred talking points and why we disagree with it:
1) Many of the bank issuers are major banks: JPMorgan is the biggest issuer
Counterpoint: Major banks do not look concerning but it is impossible to predict what would happen in a downturn let alone a financial crisis. The issue is the concentration of financial and bank issuers from a risk management perspective. Even if no banks collapse, there is likely much higher volatility ahead which is less than ideal for an income investor (just look at preferred performance in March of this year). We have little doubt about JPMorgan as an organization coming out a winner but it'll be a roller coaster even in an optimistic scenario.
2) Low default rates
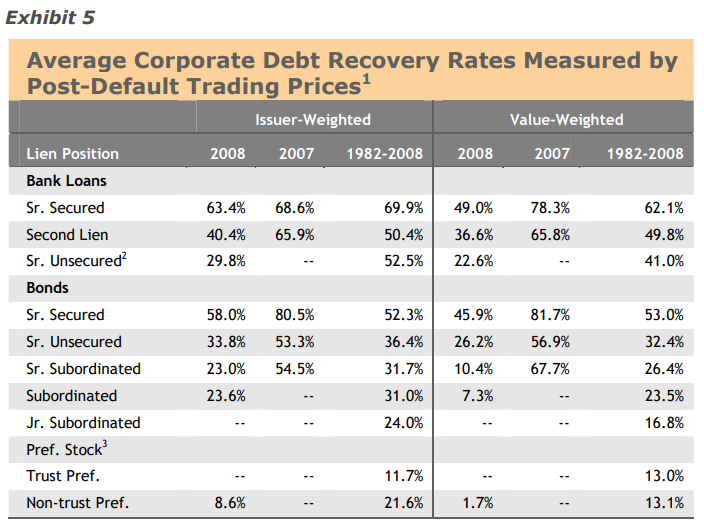
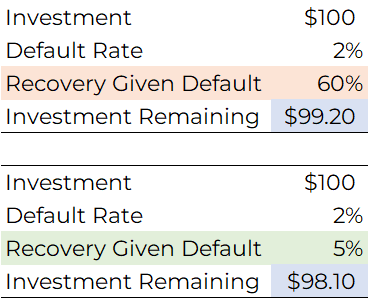
Counterpoint: While preferreds over a long period of time may have a low default rate on a percentage basis, the loss given default is near 100%. Preferred stock recovery value in default is much closer to common stock than bonds. When a corporate bond or loan defaults, there is some level of recovery and you do not lose all your investment. The difference in recovery value is a big driver of returns in credit investing.
3) Active management can add value through issuer selection
Counterpoint: There is little data to show value-add of active preferred funds relative to a preferred index.
4) If the preferreds are called, you can re-invest at higher rates (a PM claimed this on a webinar recently .. no joke)
Counterpoint: While this may apply to a select number of retail fixed-to-floats issued in a different rate environment, it is unlikely there are many treasurers that subscribe to the “pre-pay early to borrow at higher rates” philosophy.
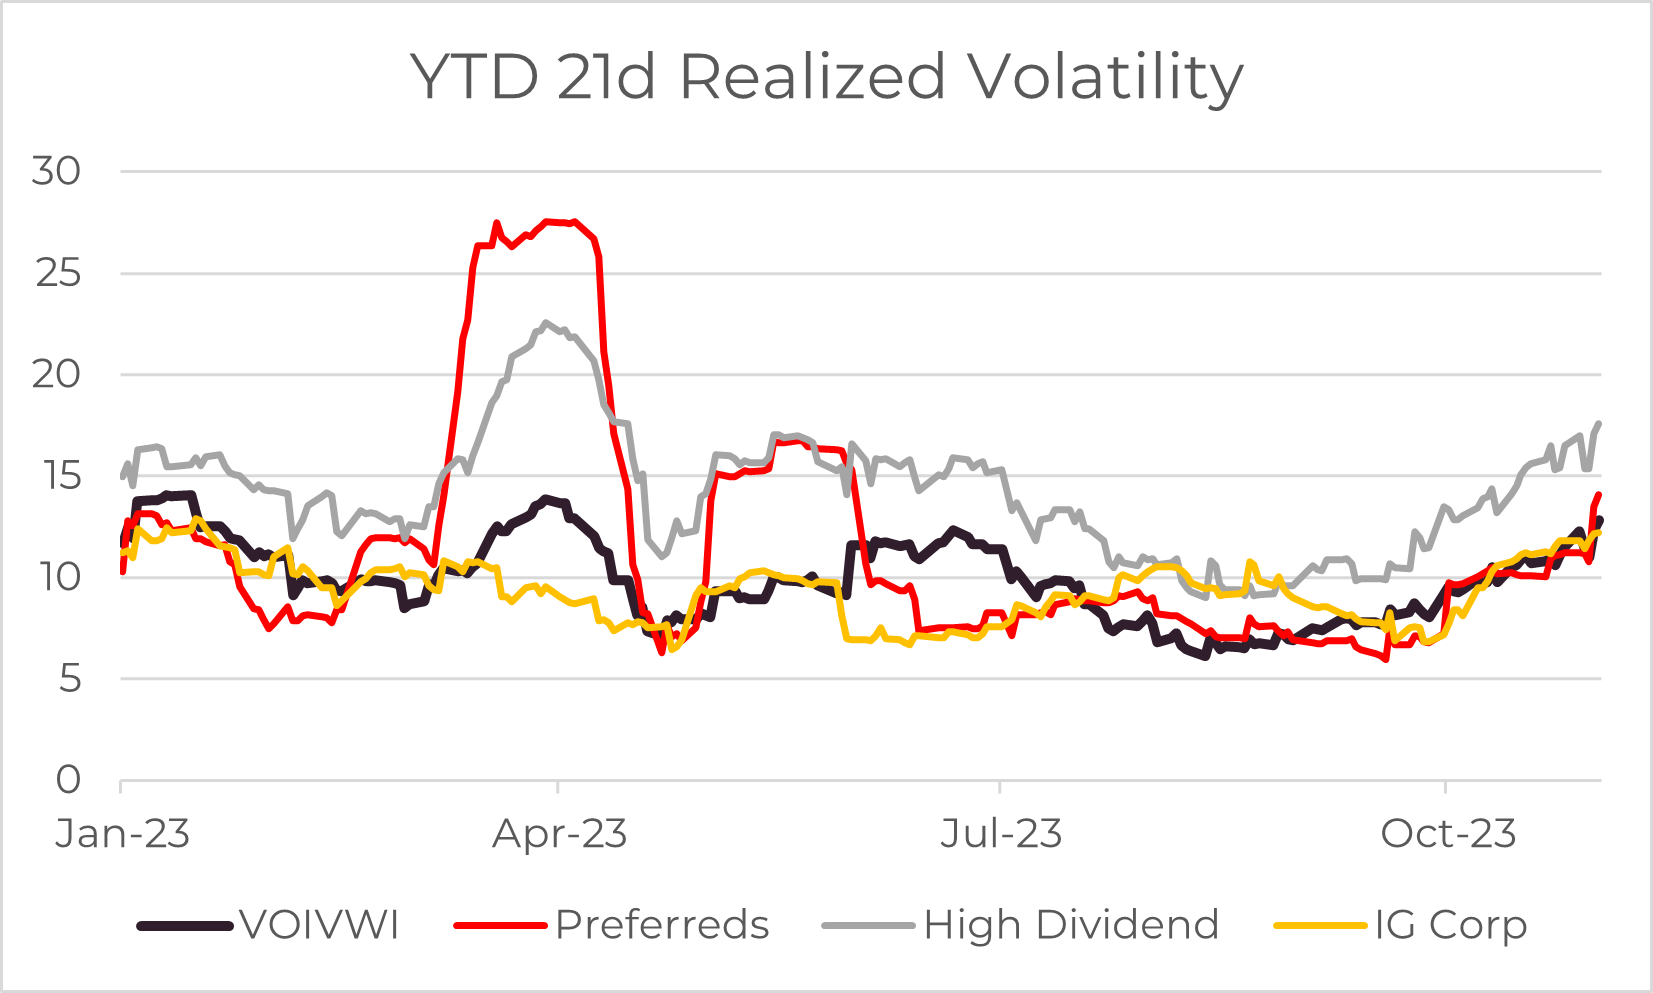
We are not the only ones questioning owning preferreds here: the market is as well. Realized volatility of preferreds have increased meaningfully relative to other income indices over the last 2 months.
This is an opportune time to decrease preferred stock exposure and find similar current income with better risk/reward. Please reach out to us if you would like to learn about how our income products can be a better fit in your portfolio.
| As always your thoughts and feedback are very much appreciated! |


